Monitoring WAN latency with InfluxDB
This is a simple, ‘quick and dirty’ way to measure network latency over long periods of time. The only ‘complicated’ part is setting up InfluxDB, but I imagine that many folks already have it set up. To get started, check the official documentation.
Network latency will be measured with the good old ping command, then formatted with generic Unix tools. Then, statistics are stored using the influxdb write endpoint using the line protocol format. It’s a very simple and elegant API if you ask me.
Bash script
A simple bash script is created at /opt/pingmon.sh
#!/bin/bash
curl -i -XPOST "http://localhost:8086/write?db=netstats" \
    --data-binary "ping,dest=cloudflare $(ping -c 1 1.1.1.1 | \
    awk '/time=/{print $7}' | sed -e 's/time/rtt/g') $(date +%s%N)"
When run, this will output the InfluxDB line format:
ping,dest=cloudflare rtt=27.0 1607388217665469702
A few notes about the command:
- InfluxDB requires nanosecond timestamps, so the Unix epoch plus the nanosecond timestamp is output by
date +%s%N - The field
timeis reserved and cannot be used as part of a measurement, so thesedstatement replaces ’time’ with ‘rtt’
Cron job
Using cron, the script is run every minute.
* * * * * nobody /opt/pingmon.sh
For security the script is run with absolutely no local access. If logging to a local file, it may be preferred to run as a local user instead.
More destinations
To better ‘map’ the internet, I can copy this line and change the ‘dest’ tag. For example, monitoring Google’s 8.8.8.8 ip:
curl -i -XPOST "http://localhost:8086/write?db=netstats" \
    --data-binary "ping,dest=google $(ping -c 1 8.8.8.8 | \
    awk '/time=/{print $7}' | sed -e 's/time/rtt/g') $(date +%s%N)"
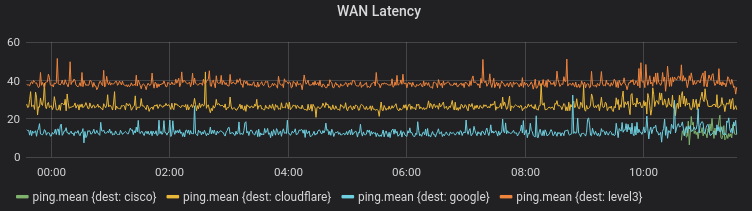
Dashboard
Finally, using Grafana we can chart out these trends over time. Grafana is one of the simplest ways to view influxdb data, and can be installed very easily.