Simple Linux server alerts: Know your performance, errors, security, syslog, and security
Log aggregation systems are fantastic. As are time-series metrics databases. But that’s not what this post is about. These methods aren’t a replacement for those systems at all, but a basic way to implement the core basics of monitoring and alerting.
You see, the strength of a SIEM or log aggregation system is its numbers. It correlates data from hundreds or thousands of sources, giving very important insights about overall system usage patterns, login activity, audit trails, and more.
However, if you’re using that system for stupid alerts like “An error happened on server XYZ”… Well, you’re doing it wrong. Things should be simple, and simple alerts shouldn’t come from complex systems.
There are three main pieces of information an operator needs about a system:
- Actionable alerts that expose meaningful problems
- Historical utilization data to make good decisions
- Occasional reports so you know everything is okay
And of course, there’s a very fine balance to this. Too many alerts and reports become tiresome and annoying. Alert fatigue sets in very quickly, and goes away slowly. Worse, too little information means you could miss important signs of failure leading to preventable downtime.
I wish I could say there was a magic, universal good configuration for every situation but there isn’t. That’s a journey that every admin has to take for themselves.
But like everything, you can get a good distance for cheap - it’s the rest that’s “expensive” so let’s get the “cheap” parts.
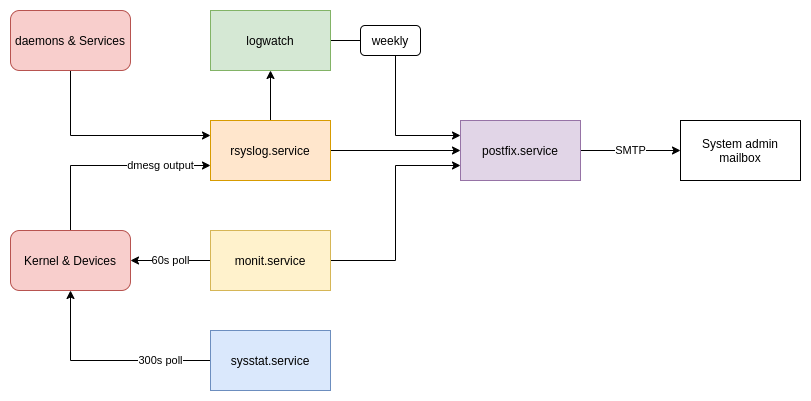
We’ll use a few basic systems.
- Postfix, to send informational emails
- Rsyslog, to issue system error alerts
- Monit, to check the system’s health
- Sysstat, to aggregate performance data
- Logwatch, to create weekly status reports
These are all very simple utilities, and are in the default software repositories for Ubuntu or Debian.
Postfix mail relay
Almost all of these messages will be sent by email, so having a way for your system to send you messages is the first step towards a working solution.
There are lots of mail transfer agents and relays for Linux, but the most well known is probably Postfix.
First, postfix must be installed from the repositories:
sudo apt install -y postfix mailutils libsasl2-2 libsasl2-modules ca-certificates ssl-cert
Then, the basic relay-only config can be added, replacing the default /etc/postfix/main.cf:
mynetworks = 127.0.0.0/8, [::1]/128
inet_interfaces = 127.0.0.1
relayhost = [mail.example.com]:587
smtp_sasl_auth_enable = yes
smtp_sasl_password_maps = hash:/etc/postfix/sasl_passwd
smtp_sasl_security_options = noanonymous
smtp_use_tls = yes
smtpd_relay_restrictions = permit_mynetworks, permit_sasl_authenticated, defer_unauth_destination
alias_maps = hash:/etc/aliases
alias_database = hash:/etc/aliases
smtpd_tls_cert_file=/etc/ssl/certs/ssl-cert-snakeoil.pem
smtpd_tls_key_file=/etc/ssl/private/ssl-cert-snakeoil.key
smtpd_use_tls=yes
Next, an upstream and credentials must be configured. You can either use your own email provider, so long as they support SMTP, or a dedicated relay service like Amazon SES, Twilio, or Mailgun.
This is configured using the file /etc/postfix/sasl_passwd
Some examples (you only need one!)
# Gmail:
[smtp.gmail.com]:587 [email protected]:password

# Mailgun:
[smtp.mailgun.org]:587 [email protected]:password

# Amazon SES:
[email-smtp.us-east-1.amazonaws.com]:587 user:pass
Note that the “relayhost” line in main.cf must be edited to reflect this:
relayhost = [smtp.gmail.com]:587
Once this is set up, the password can be hashed for postfix:
sudo postmap /etc/postfix/sasl_passwd
Then, postfix can be restarted to pick up the changes:
sudo systemctl restart postfix.service
To make sure root mail gets forwarded, check the aliases and make sure your email address will get root’s emails:
root: [email protected]
Be sure to also refresh the aliases:
sudo newaliases
You may check the sending abilities by sending yourself an email, via root:
echo "Hello, root!" | mail -s "A message for Charlie Root" root
Another advantage of having a mailer and aliases set up is that any misconfigured cron jobs will send their output to your email. This makes it very easy to diagnose issues early, before they become serious problems. In general, I like to send a cron job’s stdout to a log file, and the stderr to email. For example, this daily task will only email any errors, if there are any, and all regular output gets sent to a logfile.
MAILTO=root
0 0 * * *   root   /usr/local/bin/foobar 2>&1 1>/var/log/foobar.log
Practically every task can be set up this way, making it easy to catch failed backup jobs, bad auto-updates, log rotation issues, and more.
Why? Because email is a very deeply integrated messaging protocol in Unix systems, and it’s very easy to make services output their alerts, reports, logs, and other data to a local email relay. It’s also very nice to have a fully featured MTA onboard that’s capable of queueing, retrying, and managing message flow.
Rsyslog alerts
Now that email is configured, the rest is comparatively simple. Rsyslog is most likely already installed, and setting up alerts is a simple matter of adding a single file.
Create /etc/rsyslog.d/alert.conf with this content:
module(load="ommail")
template (name="mailBody"  type="string" string="Alert for %hostname%:\n\nTimestamp: %timereported%\nSeverity:  %syslogseverity-text%\nProgram:   %programname%\nMessage:  %msg%")
template (name="mailSubject" type="string" string="[%hostname%] Syslog alert for %programname%")

if $syslogseverity <= 3 then {
   action(type="ommail" server="127.0.0.1" port="25"
          mailfrom="rsyslog@localhost"
          mailto="root@localhost"
          subject.template="mailSubject"
          template="mailBody"
          action.execonlyonceeveryinterval="3600")
}
Quite simply, this will report any syslog message with a severity of “Error” or higher. It will also pause for an hour after any email to reduce the “spam factor” slightly.
If there are certain messages that should be excluded, those can be added to the same line using a match statement. For example, OpenVPN can log bad auth attempts as errors, which is not alert-worthy. This line can be edited:
if $syslogseverity <= 3 and not ($msg contains 'cannot locate HMAC') then ...
Other “spammy” messages can be filtered this way, through the process known to some as artificial ignorance.
An example email, from a time I mis-formatted a Bind zone file:
Alert for router:

Timestamp: Dec 12 17:01:22
Severity:  err
Program:   systemd
Message:   Reload failed for BIND Domain Name Server.
Why? Because when malfunctions happen, it’s best to know right away. Most services respect the syslog severity levels, making it very easy to know when something goes wrong.
Monit
The next system to set up is Monit. Monit is a very simple and powerful Unix tool to check and alert when a system is outside of normal operating conditions.
Install monit:
sudo apt install monit
The config file can be added to /etc/monit/monitrc
mailserver 127.0.0.1
set alert root@localhost
  but not on { instance, action }

set mail-format {
  from:    root@$HOST
  subject:  [$SERVICE] $DESCRIPTION
  message: Alert for $SERVICE
Date:        $DATE
Action:      $ACTION
Host:        $HOST
Description: $DESCRIPTION
}
set httpd unixsocket /var/run/monit.sock
  allow user:pass

check system $HOST
  if loadavg (1min) per core > 2 for 5 cycles then alert
  if loadavg (5min) per core > 1.5 for 10 cycles then alert
  if cpu usage > 95% for 5 cycles then alert
  if memory usage > 90% then alert
  if swap usage > 50% then alert

check device root with path /
  if space usage > 90% then alert
  if inode usage > 90% then alert
  if changed fsflags then alert
  if service time > 250 milliseconds for 5 cycles then alert
  if read rate > 500 operations/s for 5 cycles then alert
  if write rate > 200 operations/s for 5 cycles then alert

check network eth0 with interface eth0
  if failed link then alert
  if changed link then alert
  if saturation > 90%  for 2 cycles then alert
  if download > 10 MB/s for 5 cycles then alert
  if total uploaded > 1 GB in last hour then alert

check host REACHABILITY with address 1.1.1.1
  if failed ping with timeout 10 seconds then alert
This configuration will check the system load, memory usage, disk usage and performance, network usage and status, and whether the system can ping CloudFlare’s IP. There are lots more checks that can be used. Monit, though very simple, can effectively monitor webservers, database servers, hardware sensors, basic security checks, certificate expiry, and more…
When an alert is fired, the email will be sent with this format:
Alert for eth0
Date:        Sun, 12 Dec 2021 19:08:51
Action:      alert
Host:        webserver
Description: link down
You can also check the system’s status and view a mini-dashboard:
$ sudo monit summary

┌─────────────────────────────────┬────────────────────────────┬───────────────┐
│ Service Name                    │ Status                     │ Type          │
├─────────────────────────────────┼────────────────────────────┼───────────────┤
│ webserver                       │ OK                         │ System        │
├─────────────────────────────────┼────────────────────────────┼───────────────┤
│ root                            │ OK                         │ Filesystem    │
├─────────────────────────────────┼────────────────────────────┼───────────────┤
│ eth0                            │ OK                         │ Network       │
├─────────────────────────────────┼────────────────────────────┼───────────────┤
│ REACHABILITY                    │ OK                         │ Remote Host   │
└─────────────────────────────────┴────────────────────────────┴───────────────┘
Why? A very large number of preventable server crashes are caused by two things: Out-of-memory and out-of-disk conditions. By keeping a handle on these, we can easily avoid issues when system utilization gets dangerously high. It’s also important to set the thresholds high enough, a threshold too low will trigger annoying alerts too frequently.
Sysstat
Sysstat is a very basic utility to log historical system usage data with coarse granularity. To be clear, if you’re looking for a tool to give subsecond accurate CPU graphs, reach for Netdata or a complex Prometheus deployment. Sysstat merely answers the question, “Did the CPU spike when $thing happened?”
Installing is very simple:
sudo apt install sysstat
Likewise, enabling collection is a single-line change in /etc/default/sysstat
ENABLED="true"
By default, it will collect metrics every 600 seconds, though this interval can be reduced by editing the crontab or systemd timer. I prefer to adjust this timer down to 300 seconds, and enable collection of all counters:
*/5 * * * * root /usr/lib/sysstat/sa1 1 1 -S ALL
After some data has collected, you can use the sar command to view the system usage:
03:10:01 PM     CPU     %user     %nice   %system   %iowait    %steal     %idle
03:15:01 PM     all     94.56      0.00      5.00      0.02      0.00      0.42
03:20:01 PM     all     96.04      0.00      3.65      0.03      0.00      0.28
03:25:01 PM     all     78.58      0.00      2.55      0.01      0.00     18.86
03:30:01 PM     all      0.63      0.00      0.64      0.03      0.00     98.71
03:35:01 PM     all      1.07      0.00      0.68      0.08      0.00     98.17
03:40:01 PM     all      0.60      0.00      0.57      0.03      0.00     98.80
03:45:01 PM     all      0.60      0.00      0.53      0.02      0.00     98.85
03:50:01 PM     all      1.00      0.00      0.68      0.07      0.00     98.25
03:55:01 PM     all      3.64      0.00      0.66      0.03      0.00     95.67
04:00:01 PM     all     26.82      0.00      1.72      0.02      0.00     71.43
It will appear nicely colour coded on most modern terminals.
You can also view other system attributes using the sar command, for example:
- For memory stats, use
sar -r - For IO stats, use
sar -b - For network status, use
sar -n DEV - For load and queue stats, use
sar -q LOAD
You can also convert these to SVG format using sadf command, and view them using the display tool (requires imagemagick):
sadf -g -- -q LOAD -b | display
Why? While it can’t send alerts, sysstat can keep a log of system performance over time. This gives us a very easy way to answer questions like, “Was the server under heavy load last night?”, while not requiring additional infrastructure or dependencies.
Logwatch
Logwatch is a program that creates a report by reading logs and historical server data.
Install the logwatch utility:
sudo apt install logwatch
Then, configure the report by editing /etc/logwatch/conf/logwatch.conf:
LogDir = /var/log
TmpDir = /var/cache/logwatch
Output = mail
Format = text
Encode = none
MailTo = root
MailFrom = Logwatch
Archives = Yes
Range = between -7 days and -1 days
Detail = Low
Service = All
Service = "-zz-network"
Service = "-zz-sys"
Service = "-eximstats"
mailer = "/usr/sbin/sendmail -t"
The default reports runs daily, which is too often for most people - it will become ‘spammy’ far too soon, and be ignored soon after.
Instead, we will configure it for weekly reports only. First, remove the cron.daily script:
sudo rm -v /etc/cron.daily/00logwatch
Then, a new configuration is added to /etc/cron.d/logwatch:
# Weekly report job:
MAILTO="root"
0 0 * * 1   root    /usr/sbin/logwatch
This will cause it to only execute on Mondays at midnight.
Why? even if a system doesn’t send any alerts, doesn’t mean there isn’t anything wrong. It’s still a very good idea to have occasional system reports to keep a tabs on the ongoing operations of a system.
All together, this forms what I would consider both the bare minimum for most servers, and a great starting place. From here, many more opportunities for monitoring, security auditing, and log aggregation. Another great addition are security utilities, such as Fail2ban, Ossec, and more… Read about it here.